Posts

Tip #1402 – Using Sales IQ to Identify New Customers for a Manufacturer

Sales IQ has a unique feature that will allow you to identify new customers by identifying those that had no sales activity in the previous year but have purchased in the current year.  This can be accomplished by using Display New Sales YTD or MTD.

To Identify This Year’s New Customers for a Manufacturer:

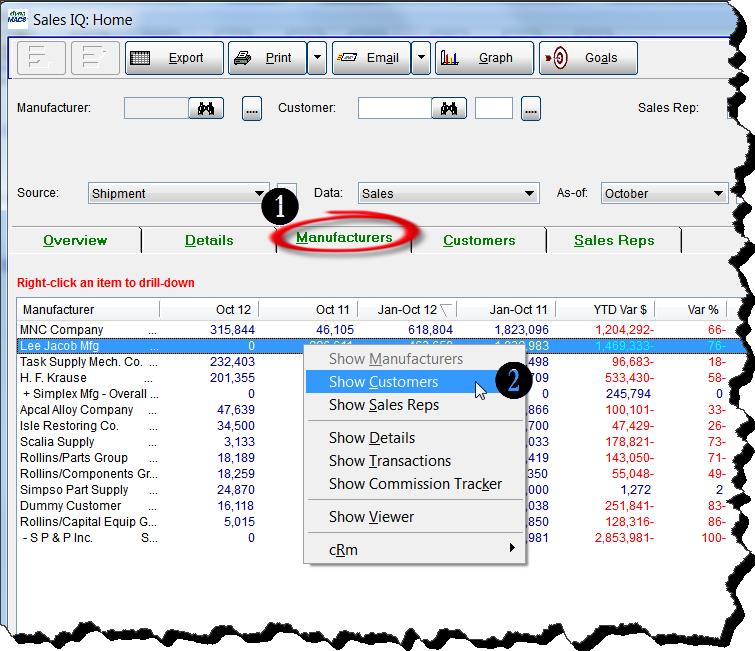
  1. From the Sales IQ screen select the Manufacturer tab.
  2. Right click on a manufacturer and select Show Customers. Sales IQ Home
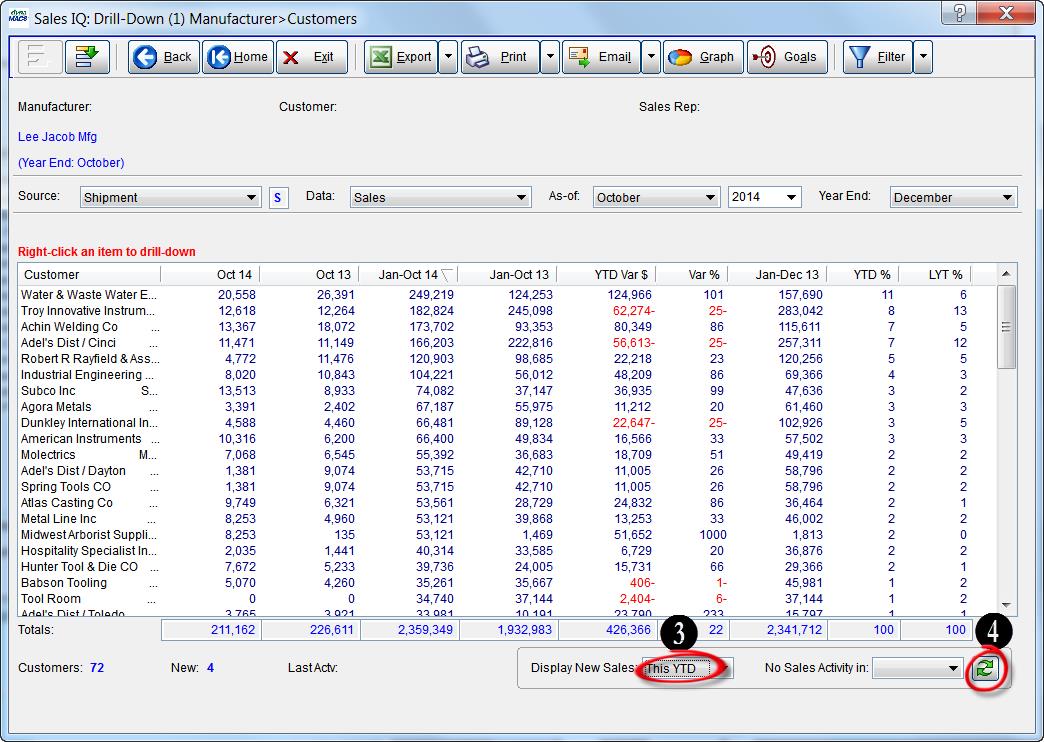
  3. Select This YTD from the Display New Sales drop down list.
  4. Select the Refresh button.Sales IQ Home 2
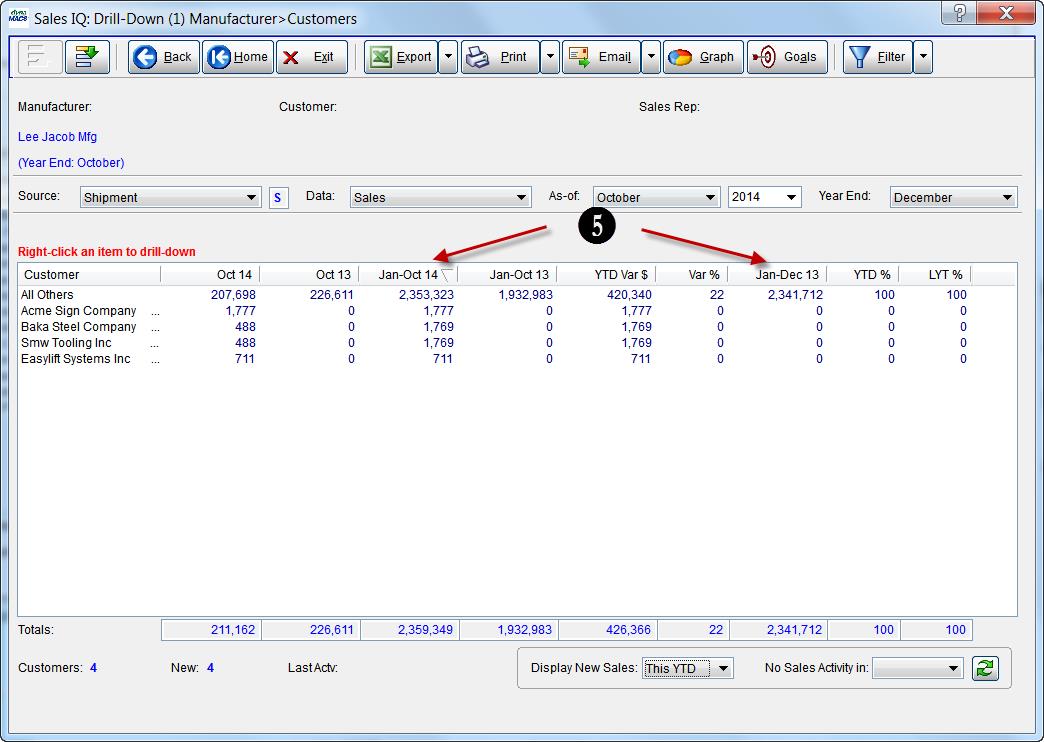
  5. You will notice that the list has been filtered to display only customers with YTD sales that had NO sales in the previous year for this manufacturer.Sales IQ Home 3

Tip #1401 – dynaMACS File Transfer/Combine Wizard

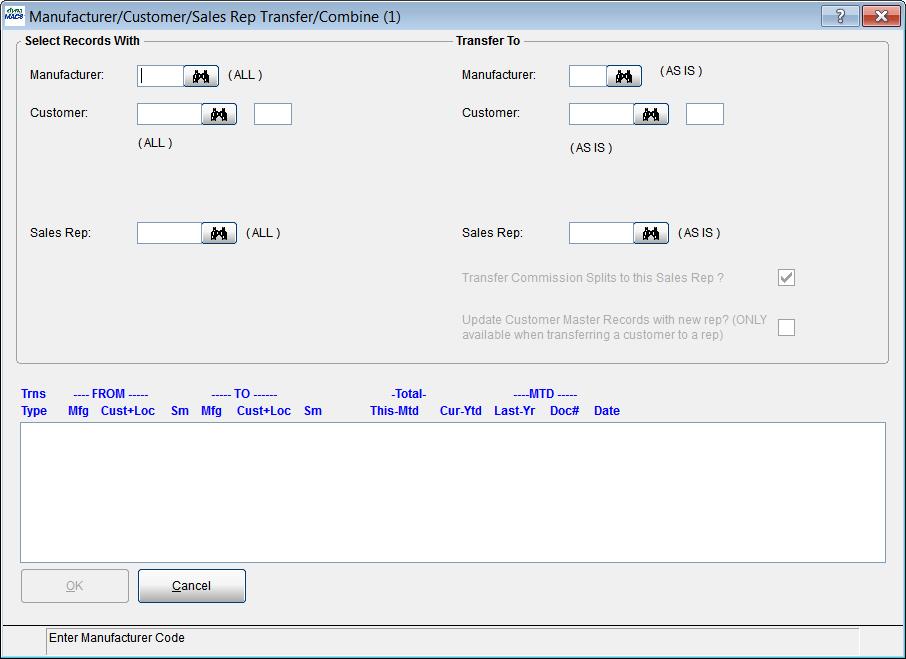
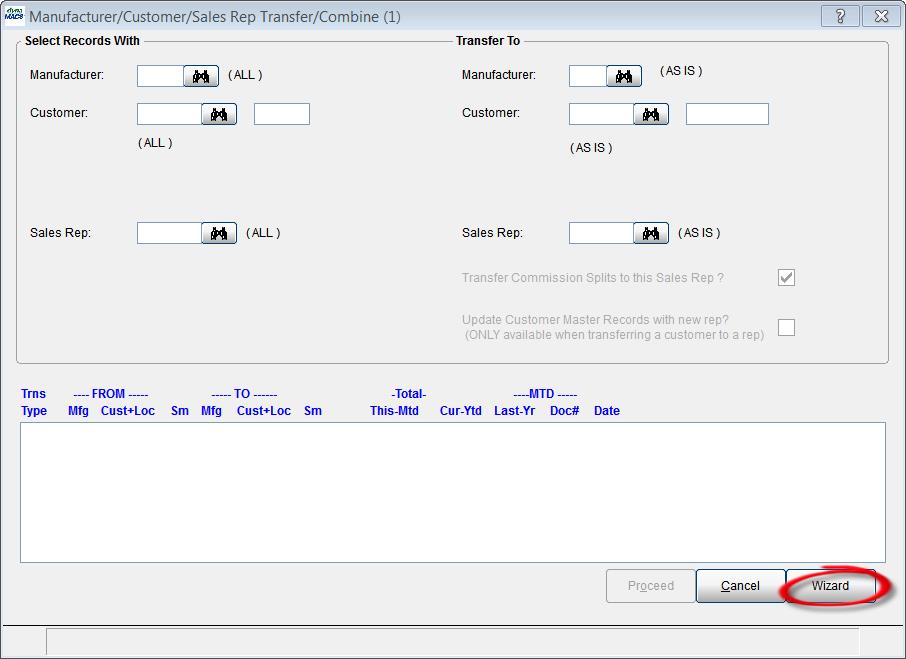
The Mfg/Cst/Rep Transfer (1)screen has been modified to include a “wizard” button which when selected will help make the transfer process easier for you.

Old Screen . . .

Transfer Combine Screen - Old

New Screen . . .

Transfer Combine Screen - New

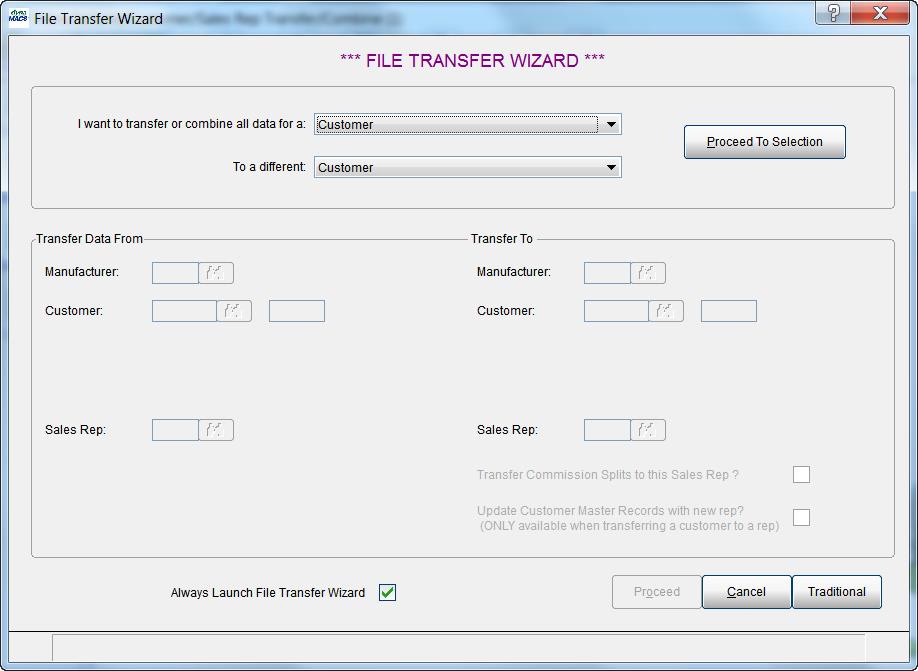
When selecting the Wizard button the File Transfer Wizard screen will open. This screen is designed to help ease you through the File Transfer/Combine process.

Wizard Screen

Example

In the following example we will transfer all data from a customer to a new sales rep.

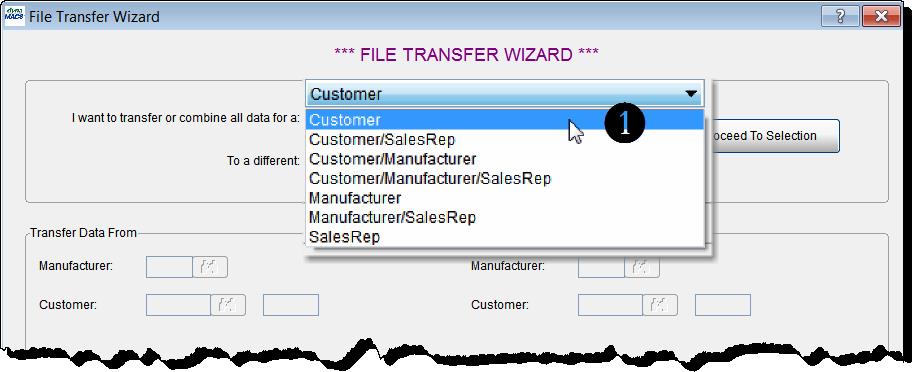
  1. From the File Transfer Wizard screen select the Customer option from the drop down list in the I Want to Transfer or Combine all data for a: Wizard Screen 2
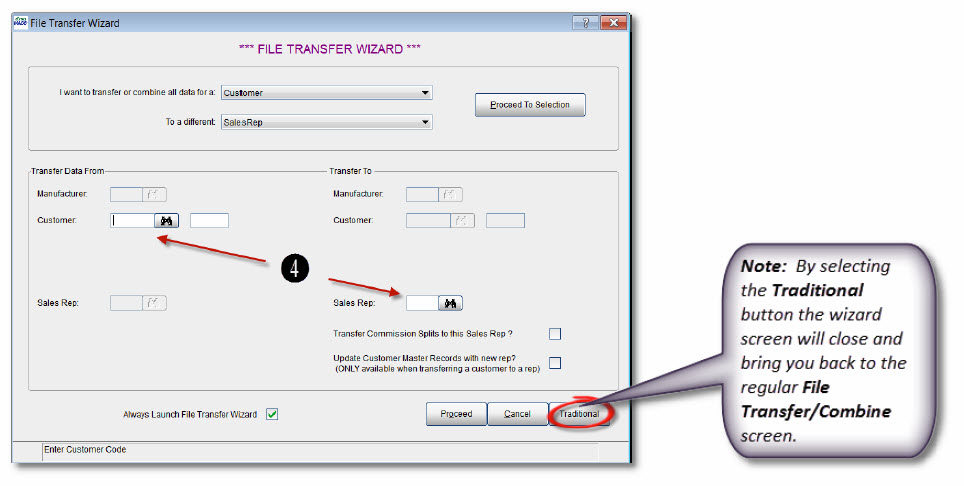
  2. Select the SalesRep option from the drop down list in the To a different:field.
  3. Select the Proceed To Selection button.Wizard Screen 3
  4. You will notice that after selecting the Proceed To Selection button, the Customer field and the Sales Rep field have been activated in the Transfer Data From and Transfer Data To section of the screen.This screen is very similar to the regular File Transfer/Combine (1) screen, only it will take the guess work out of it by allowing you to only enter data into the fields that have been activated based on your selections in the upper portion of the screen.Wizard_Step4
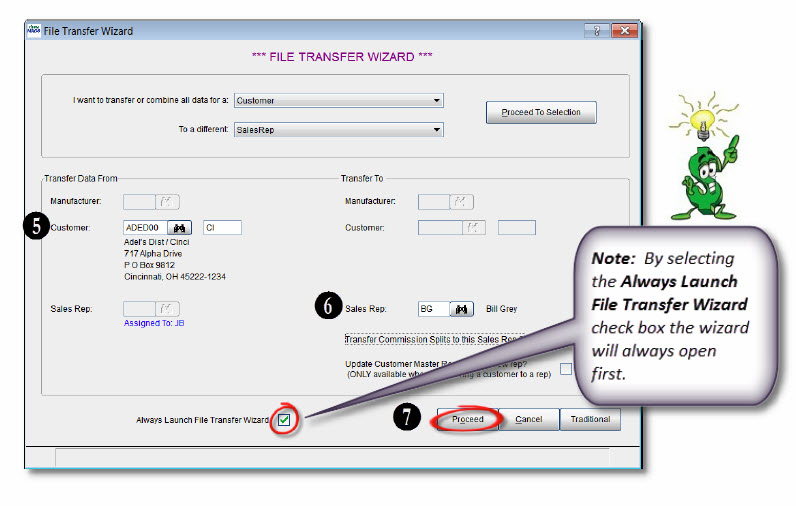
  5. Enter the Customer Code or use the Search button to find the code.In this example we will use Adel’s Dist ADED00 location Cincinnati>CI.
  6. For the Sales Rep we will use BG for Bill Grey.
  7. Select the Proceed button.At this point the file transfer process will proceed as normal.Wizard_Step567

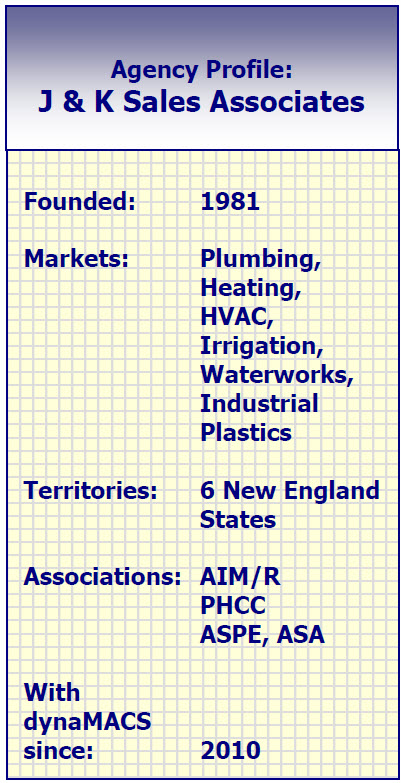
Case Study: J & K Sales Associates

“The software is so flexible. We can see data in so many different ways and drill down for more details. It gives us a deeper understanding of the agency’s performance.”

Helen Degli-Angeli, Operations Manager
J & K Sales Associates

J_&_K_Sales_LogoClient Challenge

dynaMACS takes reporting capabilities to new levels. J & K Sales Associates was using custom-built reporting software to track agency sales and commissions in conjunction with their distributor software. But the two didn’t play well together.

“Running reports took forever,” says Operations Manager Helen Degli-Angeli. In addition, there was a limited selection of reports available. Slowing processes more, any new reports or report changes required a programmer.

J_&_K_Sales_StatisticsdynaMACS Solution

While the custom software drained agency resources, dynaMACS freed up time. Degli-Angeli sums up dynaMACS in two words: faster and easier.

Degli-Angeli discussed other benefits of dynaMACS:

Streamlined

Processes like report generation and importing manufacturer sales and commission information are streamlined. The powerful software does the heavy lifting, reducing the agency’s administrative tasks.

Singular

From one complete database users can see buy-sell sales, rep commissions and more, for a complete view of the agency’s performance.

Flexible

The flexibility to select data by manufacturer, customer or rep is key Degli-Angeli says, “The flexibility to see data in so many different ways and drill down for more information gives us a deeper level of understanding into our agency’s performance.”

Accurate

dynaMACS reduces the human error involved with manually re-typing data to transfer it from one system to another. Importing information with dynaMACS eSi is automatic and instantaneous.

Tip #1312 – Using dynaMACS to analyze both your rep numbers and buy/resell numbers in one place

Many agencies operate as distributors for some of their lines. Using eSi you can import the distributor sales numbers into dynaMACS which will allow you to analyze your entire business in one place.

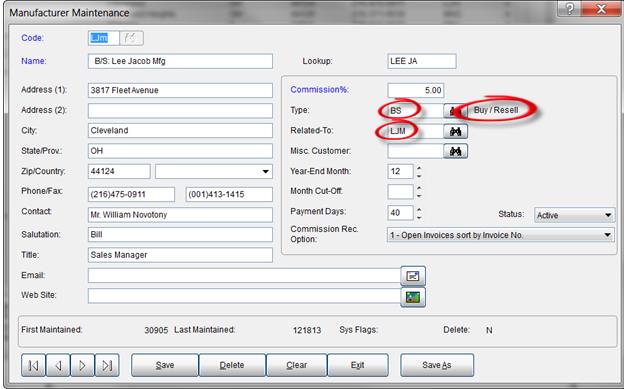
To achieve this you would first set up Manufacturer Type codes of BS (Buy/Resell) and CM (Commissions) and then relate each manufacturer record to the appropriate type. In the following example the manufacturer code LJm is classified as a Buy/Resell and is related to manufacturer LJM

Mfg Maint Screen

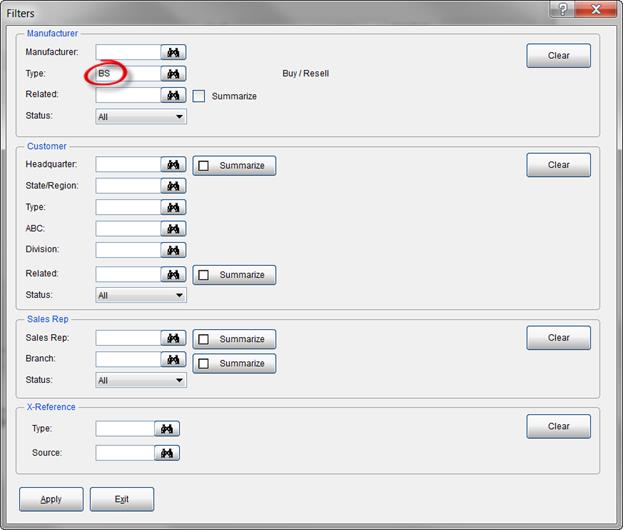
You can then filter in Sales IQ on the Typecode BS which will display all of your sales activity for this type code.

Filters Screen

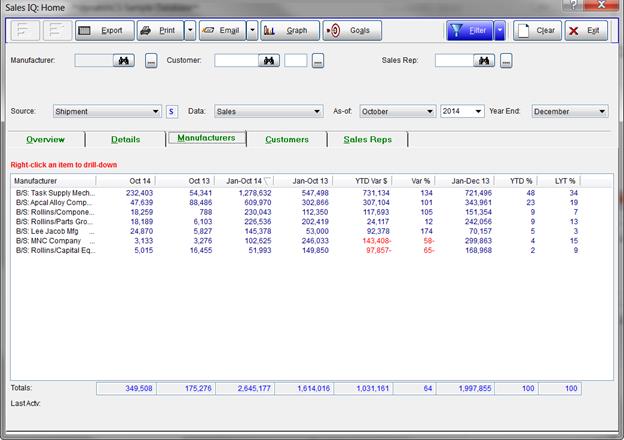
The following example displays only the activity for the Manufacturer Type code B5.

SIQ Screen 1

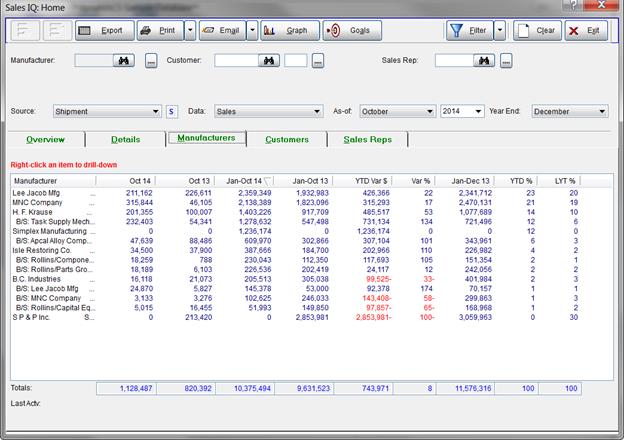
The following example is the Sales IQ screen showing commission by manufacturers PLUS Buy/Resell on the same screen.

SIQ Screen 2

Check out our case studies on www.dynaMACS.com to read about our Buy/Resell client’s experiences using dynaMACS to analyze their entire business in one place.

Case Study: Pacific Warehouse Sales

It’s crucial that our salespeople are connected to information at all times, no matter where they are. dynaMACS gives us that ability and much more.”

Deb Kanne, President
Pacific Warehouse Sales

Pacific_Warehouse_Sales_LogoClient Challenge

Pacific Warehouse Sales knows the power of technology and its ability to fuel efficiency and operations. However, the software they were using was outdated. It wasn’t user friendly and it wasn’t compatible with today’s newer computers. It was time for newer, better sales agency software.
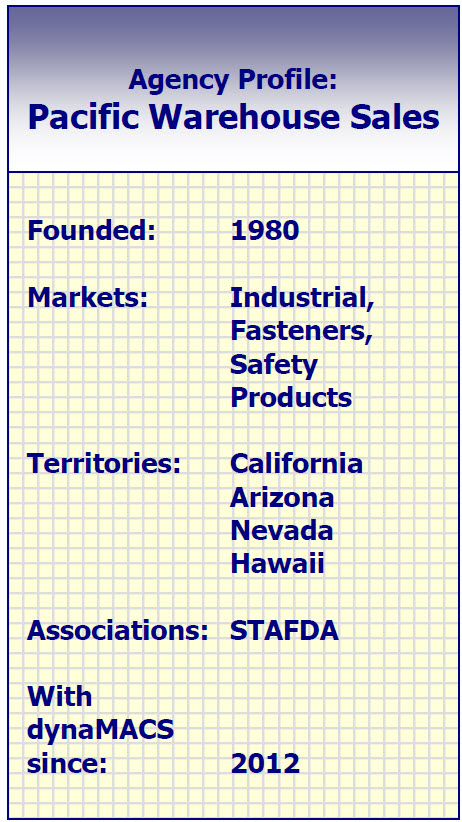


Pacific_Warehouse_Sales_StatisticsdynaMACS Solution

Deb Kanne, President of Pacific Warehouse Sales, explained that the agency selected dynaMACS because it was created specifically for sales agencies, so it has all the features Pacific needs to operate and sell at maximum capacity.

Particularly for the sales team, who live and work in geographies scattered across the western United States, Kanne says, “It’s crucial that our salespeople are connected to information, no matter where they are. dynaMACS gives us that ability and much more.”

The Pacific Warehouse sales team, all of whom have iPads or laptops, are able to access the most up-to-date sales and commission numbers immediately from wherever they are.

Pacific Warehouse Sales is on the cloud. So when the operator enters sales and commission information, it is updated instantly on the cloud. All office locations and every sales rep can access the most up-to-date information at any given moment.

An unexpected benefit has come from the agency’s use of dynaMACS. “Customers are impressed by it. We are able to show them real-time information. Before dynaMACS, the customers didn’t know if lines are up for down. The sales managers of the lines we represent are always impressed,” Kanne says.

For her job, Kanne find Sales IQ to be useful and easy-to-use. She can view data any way she likes. “I can drill down to information sorted by manufacturer, customers or salesmen. It’s a great tool that is extremely informative and helps me work more efficiently.”
Tip #1311 – How to Display Quarterly Numbers in Sales IQ

This tip is superseded by Tip #1508

In dynaMACS Sales IQ you can modify the display of data by changing the As-of and Year End dates to create a display of sales information for a specified period of time. The following examples explain how to achieve these results.

Example 1:

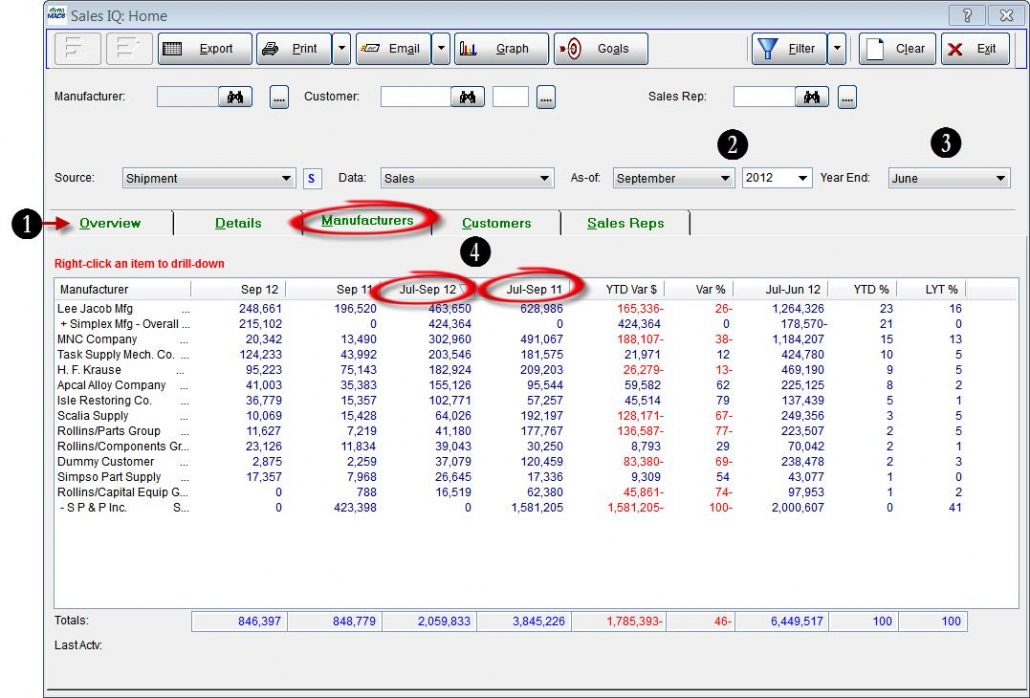
To create a Sales IQ list view displaying sales data for the 3rd quarter of the year 2012:

  1. From the Sales IQ Home screen select any tab. In this example we have selected the Manufacturers tab.
  2. Change the As-of date to the last month of the quarter you are reporting. In this case it will be September which is the last month of the 3rd quarter.Then select the year that applies.In this example we are selecting 2012.
  3. Change the Year End to the month prior to the start of the period you are reporting on. In this case it will be June since our quarter begins with July.
  4. Notice that these columns have changed to Jul-Sep12 and Jul-Sep 11 representing 3rd quarter data for 2012 and 2011.

SIQ Home Screen #1

Example 2:

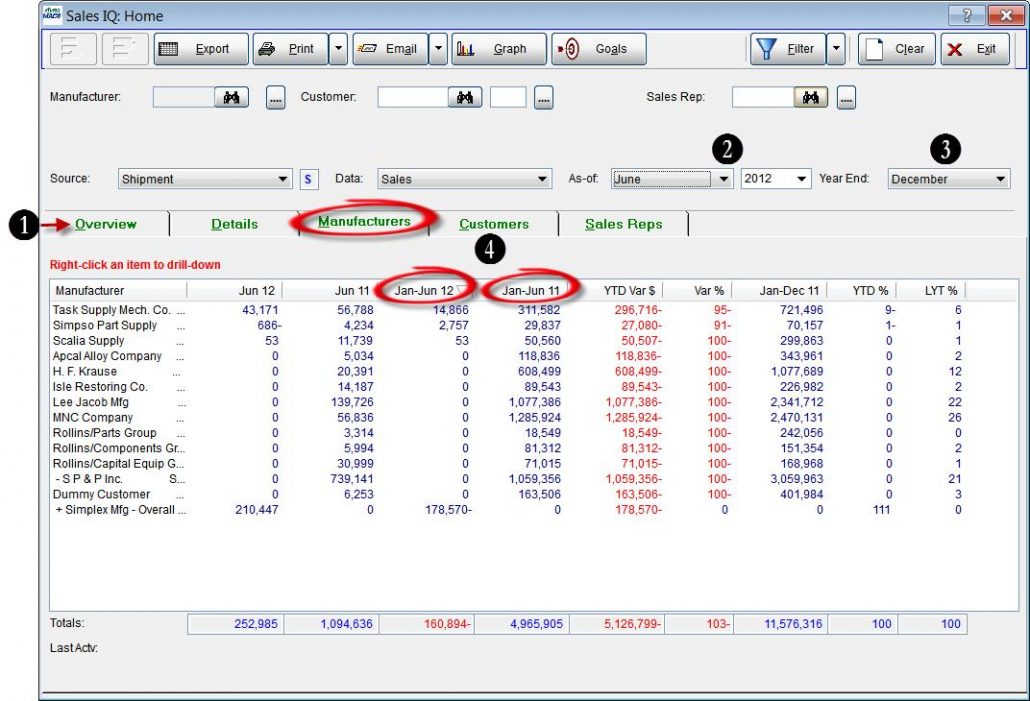
To create a Sales IQ list view displaying sales data for the first half of the year 2012:

  1. From the Sales IQ Home screen select any tab.In this example we have selected the Manufacturers tab.
  2. Change the As-of date to the last month of the half you are reporting.In this case it will be June which is the last month of the 1st half of the year. Then select the year that applies.In this example we are selecting the year 2012.
  3. Change the Year End to the month prior to the start of the period you are reporting on.In this case it will be December since our first half begins with January.
  4. Notice that these columns have changed to Jan-Jun 12 and Jan-Jun 11 representing 2nd half data for 2012 and 2011.

SIQ Home Screen #2

Quick Reference Guide

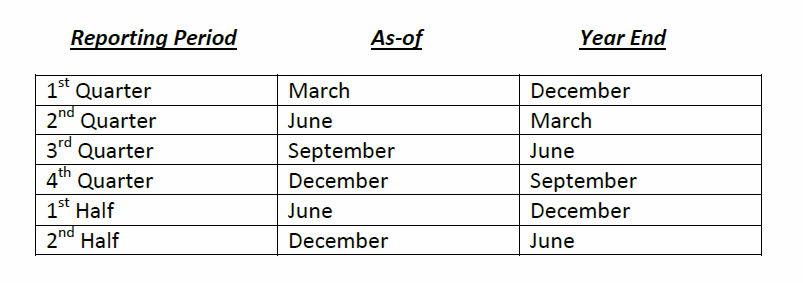
The following is a quick reference guide to use for obtaining quarterly and semi-annual data.

Reference_Graph