Posts

Case Study: Singer Carpet Corp.

 “dynaMACS makes my life easier. I always know
how the business is performing year-over-year.”

Mark Singer, President
Singer Carpet Corporation

Singer_Carpet_LogoClient Challenge

When Singer Carpet Corp. was founded in the late ‘70s, the concept of sales agency software was foreign to most sales agencies. They made due with paper records and rudimentary reports. Singer knew there must be a better way.
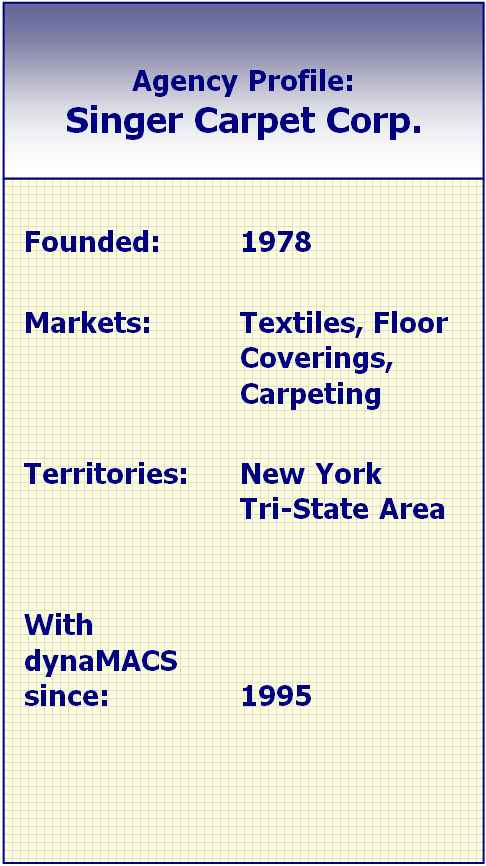
Singer_Carpet_StatisticsdynaMACS Solution

When Mark Singer, President of Singer Carpet, learned of a software solution built specifically for manufacturers’ sales agencies, he knew he wanted in and became an early adopter.

Today as a user of dynaMACS, he has a tool for analyzing agency sales, tracking commissions and paying reps. Whereas in the past the only data available was stacks of paper commission statements, today the agency has easily accessible, organized information that can be sorted and filtered for detailed information. With valuable insight into how the agency is performing, Singer says he is able to see the business in ways that without sophisticated software simply weren’t possible.

“dynaMACS makes my life easier. I always know how the business is performing year-over-year,” Singer explains.

To know exactly how the business is doing compared to previous years, Singer can select data for any point in time and view sales history for up to five years. He can view sales by customer – or with a few mouse clicks, track commissions by customer, manufacturer or sales rep. If he has a question on anything, he clicks to get more details. “dynaMACS gives me the information I need for my business, so I know where I stand company-wise and customer-wise.”

Singer sometimes brings reports with him when he visits customers, so he can share real numbers that enable him to have strategic and productive discussions with customers.
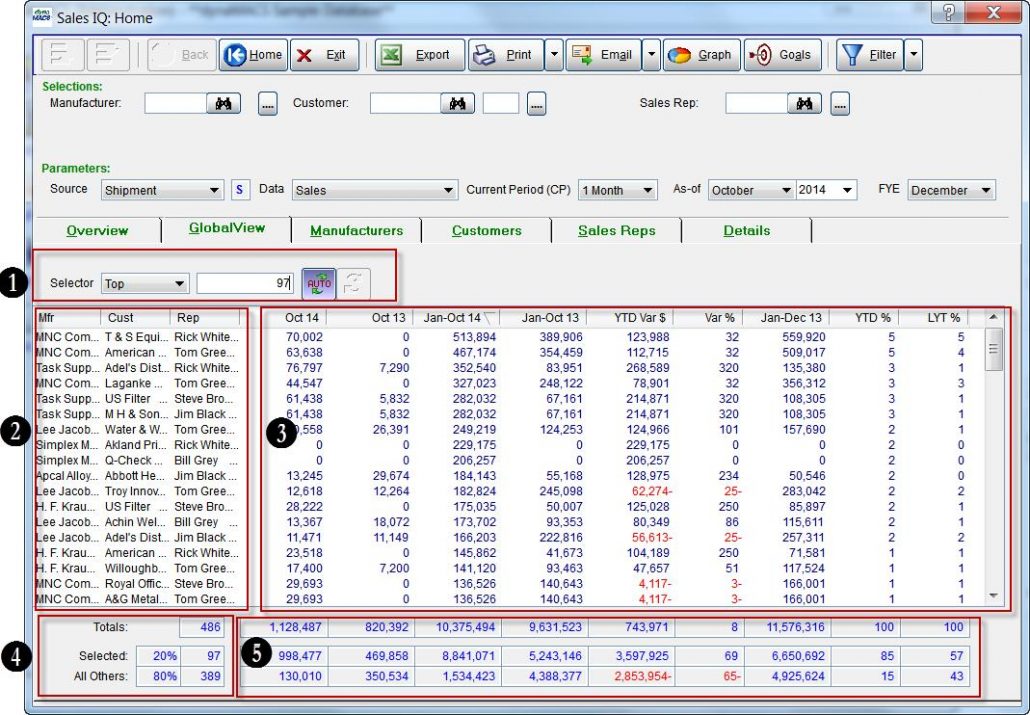
Tip # 1504 – Using dynaMACS GlobalView to see your top relationships

Overview

GlobalView is a new analytical concept developed by dynaMACS and is unique to dynaMACS Software.  Users now have the ability to view all Customer/Manufacturer relationships on a single screen.  Prior to this unique feature, users had to drill down from either Customers or Manufacturers to see these records.  Now users can easily and quickly slice and dice these Customer/Manufacturer relationship records on a single screen enabling them to analyze where they are up or down.

Features of the GlobalView Screen

When selecting the GlobalView tab dynaMACS will automatically display the “Top” 20% of the customer/manufacturer records based on the user default sort column.

SIQ Home

Selector Section

The Selector Section is used to determine what records to display in the GlobalView list.  The selector options are described below.

Selector Section 1

Top = This is the default option when first displaying the GlobalView tab and by default the top 20% of all records will be displayed.  This number may be overridden.  For example, if you want the top 10 customer/manufacturer relationships to be displayed, enter “10” in the field next to the Selector field.

All = As the name implies, all records will be displayed when this option is selected.

New = When selecting New you have the option to see new This Month or new This YTD.

Selector Section 2

AutoRefresh  is on when the auto button appears purple in color.  Sorting on a column will reload the records based on the selection criteria for that column.  AutoRefresh is off when the auto button appears grey in color.  Sorting on a column will sort the existing records on the values in that column.

Refresh button will reload based on the selection criteria for the sorted column.

Note

Relationship Names

The performance data is stored in dynaMACS by Manufacturer/Customer/Sales Rep.  In GlobalView, the names for these entities are displayed on each row of the list.

Performance Values

The performance values shown in GlobalView are consistent with the other views in Sales IQ.

Totals (Record Count)

Totals = This number represents the total number of records in the database.  If a filter is used, this number will reflect the number of records in the filtered database.

Selected = Based on the selection criteria used at the top of the list, this will show the number of selected records.  To the left of the record count is the percent value for the selected records as a percent of the total records.

All Others = Based on the selection criteria used at the top of the list, this will show the number of records “not selected”.  To the left of the record count is the percent value for the not selected records as a percent of the total records.

Totals (Performance Values)

Totals = The performance values totals shown in GlobalView are consistent with the other view in Sales IQ.

Selected = These totals represent the performance value totals based on the selection criteria used at the top of the list.

All Others=These totals represent the performance value totals based on the selection criteria used at the top of the list for records “not selected”.

Case Study: Sharp Incentives

“You don’t have to be a software developer to understand how it works. dynaMACS does the work and I get the information I need quickly, without hassles.”

Tasha Sharp, President
Sharp Incentives

Sharp_Incentives_LogoClient Challenge

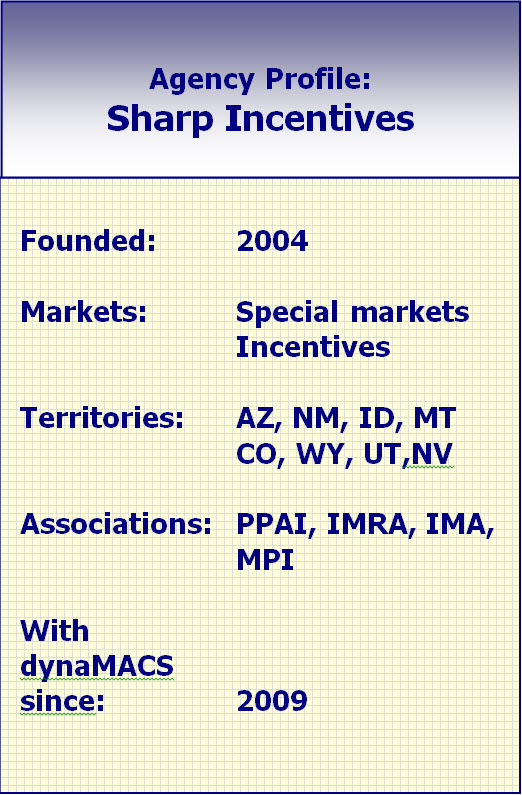
Sharp Incentives’ previous sales agency software was difficult to use and required great effort to understand how to navigate to the data the agency was looking for. Sharp Incentives President Tasha Sharp says, “It wasn’t intuitive. I had to spend time figuring out how to get to the information I needed, which was time-consuming.” Sharp wanted easy, fast and accurate software.

Sharp_Incentives_StatisticsdynaMACS Solution

When she saw dynaMACS’ user friendly interface and the ease with which she could quickly see customer, manufacturer and rep data, Sharp happily made the switch.

“You don’t have to be a software developer to understand how it works. dynaMACS does the work and I get the information I need quickly, without hassles.”

With dynaMACS, Sharp Incentives gains valuable insight into the business. “It’s robust,” she says. “You can instantly view data the way you want it.” Sharp is reaping the benefits of having complete sales and commission information at her disposal. “I’ve learned so much about my business.

Sometimes, what dynaMACS uncovers is surprising. “You might think a particular customer is your most lucrative based on sales. But actually, their commission rate is lower than another customer who buys less but at a higher average commission rate, and they turn out to be your best customer. It’s an eye-opener.” Sharp gets reports on agency commissions, broken down by sales rep, manufacturer and customer commissions..

To make accessing data even easier, Sharp uses dynaMACS on the cloud. Information is always the most recent available and it is accessible anytime, from anywhere on any device: tablet, smartphone or laptop. She’s not tied to the office when she needs information.

Case Study: E.H. & Associates

 “dynaMACS is designed specifically for sales agencies’ unique needs with features and functions to help us operate efficiently and grow the business.”

Greg Baumker, President
E.H. & Associates, LLC

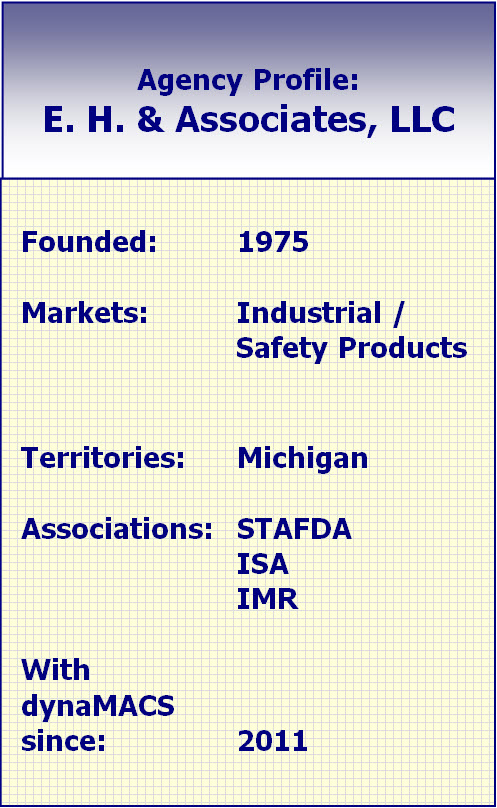
EH_Associates_LogoClient Challenge

E.H. & Associates had built a custom sales tracking software using Microsoft Access. But the agency had to continually re-write the program to update or add features. The software wasn’t keeping pace with E.H. & Associates’ business, says Vice President Barry Karlson.

“We needed software designed for sales agencies with features and functionalities that would help us operate more efficiently,” Greg Baumker, President, says. In addition, Karlson says E. H. & Associates also wanted to be unburdened from the time-consuming responsibility of managing the software.

EH_Associates_StatisticsdynaMACS Solution

By switching to dynaMACS, the agency uses software made specifically for manufacturers’ sales agencies. E.H. & Associates now has the tools to see comprehensive data in ways that are useful, meaningful and tailored to agencies’ distinct needs. The agency is able to focus on its core competency: sales.

“We have complete information about our customers, manufacturers and sales reps in a system that is easy to use, allows for growth and provides the information that we need to help us grow the business,” says Office Manager Lori Pelzel.

Unlike before, reporting is not limited to a few standard templates. dynaMACS has thousands of reports to choose from. “Flexibility is key. Reports can be as simple or as detailed as we need,” Pelzel explains. “We can sort data in so many ways. With dynaMACS we are able to identify trends, follow up on leads, monitor the status of customers and work proactively, all of which increases sales.”

E.H. & Associates also finds that sharing information with customers and manufacturers is extremely useful. “When I visit accounts, I pull up reports on my iPad,” Karlson says. “They provide detailed sales and commission data.” It’s a great way to gain insight and lead the conversation regarding sales, business challenges and opportunities to sell other lines.

Tip #1503 – Using the Sales Rep Viewer to List Customers in Various Sequences

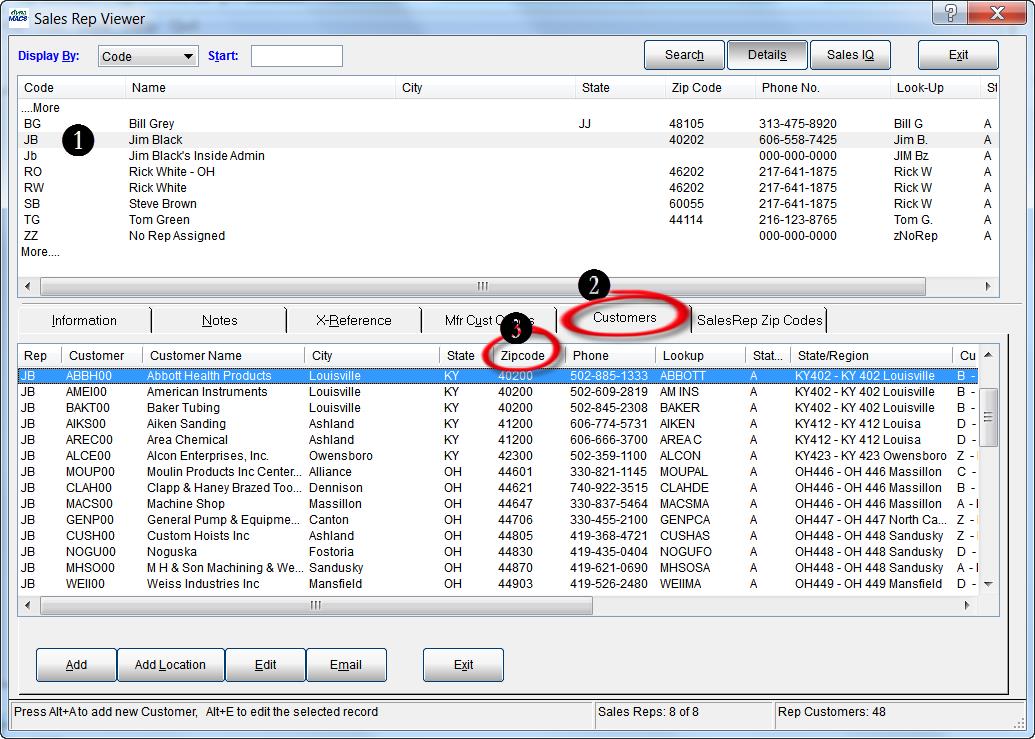
dynaMACS can help you make sales calls more efficiently by using the Sort Feature in the Sales Rep Viewer screen.  You can access your customer and contact data sorting it by city, state, zip code, phone # or any column heading in the Sales Rep Viewer screen which will group your customers based on the heading that you sort on.

Sorting in the Sales Rep Viewer Screen

In the following example we will sort Customers by Zip Code for all of Jim Black’s (JB) customers.

  1. From the Sales Rep Viewer screen highlight the sales rep code.
  2. Select the Customers tab.
  3. Click on the column heading Zipcode.  You will notice that all of the customers are now   displayed in order by Zip Code.Sales Rep ViewerNote_SalesRepViewer

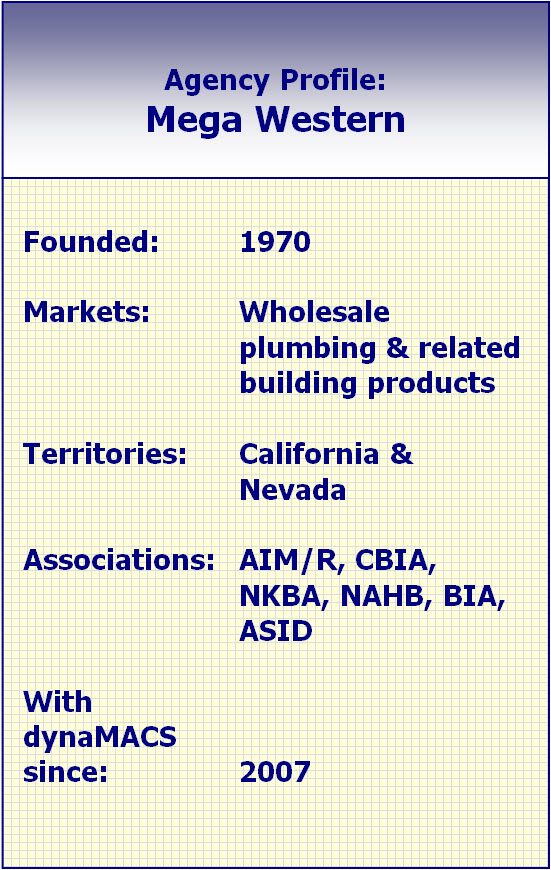
Case Study: Mega Western

 “With dynaMACS, we are able to create reports
faster and easier than any other method we’ve tried.”

Dawn Farabee, Office Manager
Mega Western

Mega_Western_LogoClient Challenge

Mega Western’s previous agency software was no longer being supported or updated. When Mega Western had questions or needed help, they were left to their own devices. As time went by, the agency quickly knew it was time for new sales agency software.

Mega_Western_StatisticsdynaMACS Solution

With dynaMACS, Mega Western has software that is updated regularly and the agency can call when they have questions and need support.

With Sales IQ, the dynaMACS analysis tool, the agency can view information such as sales, commission and performance data. Mega Western sees data such as:

  • Recent sales activity by customers
  • Sales or commissions by factory
  • Manufacturers, sequenced by year-to-date sales
  • Five-year sales history for any combination of manufacturer, customer or sales rep
  • Sales rep performance

Administrative assistant Leanne Waestman says the ability to see which customers are performing well and which are down is very helpful for Mega Western.

dynaMACS also provides the ability to drill down to more detailed data. If a sales rep asks for a particular type of information, the agency is able to provide a detailed – or high-level report.

Office Manager Dawn Farabee says dynaMACS is easier than getting reports any other way– far faster than aggregating data manually. “Creating reports manually would take a lot longer.”