Posts

Tip #1312 – Using dynaMACS to analyze both your rep numbers and buy/resell numbers in one place

Many agencies operate as distributors for some of their lines. Using eSi you can import the distributor sales numbers into dynaMACS which will allow you to analyze your entire business in one place.

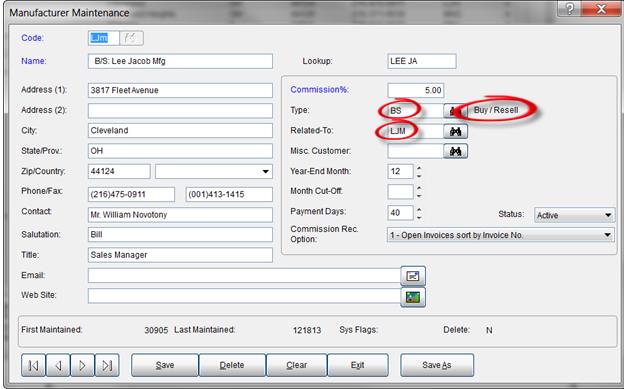
To achieve this you would first set up Manufacturer Type codes of BS (Buy/Resell) and CM (Commissions) and then relate each manufacturer record to the appropriate type. In the following example the manufacturer code LJm is classified as a Buy/Resell and is related to manufacturer LJM

Mfg Maint Screen

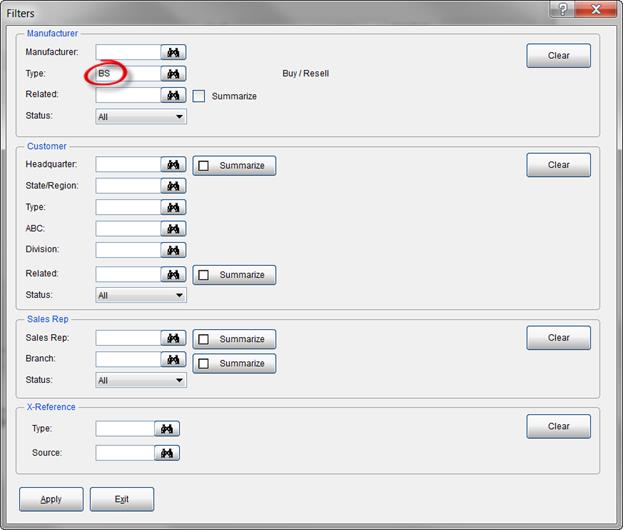
You can then filter in Sales IQ on the Typecode BS which will display all of your sales activity for this type code.

Filters Screen

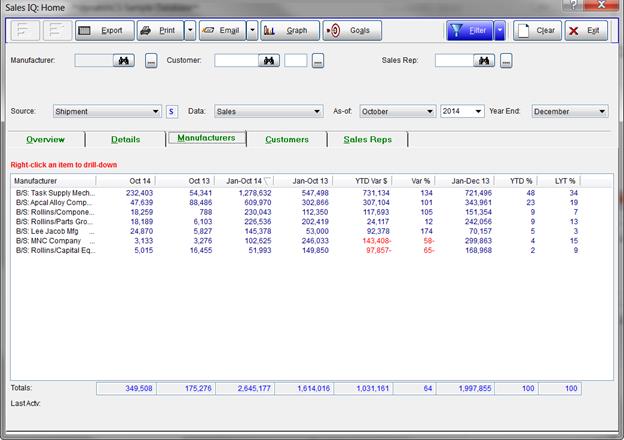
The following example displays only the activity for the Manufacturer Type code B5.

SIQ Screen 1

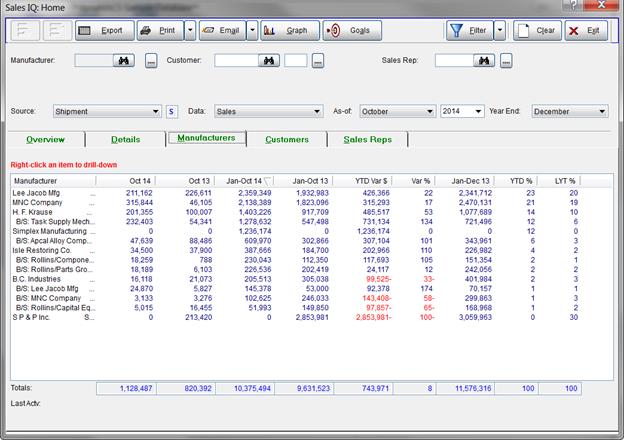
The following example is the Sales IQ screen showing commission by manufacturers PLUS Buy/Resell on the same screen.

SIQ Screen 2

Check out our case studies on www.dynaMACS.com to read about our Buy/Resell client’s experiences using dynaMACS to analyze their entire business in one place.
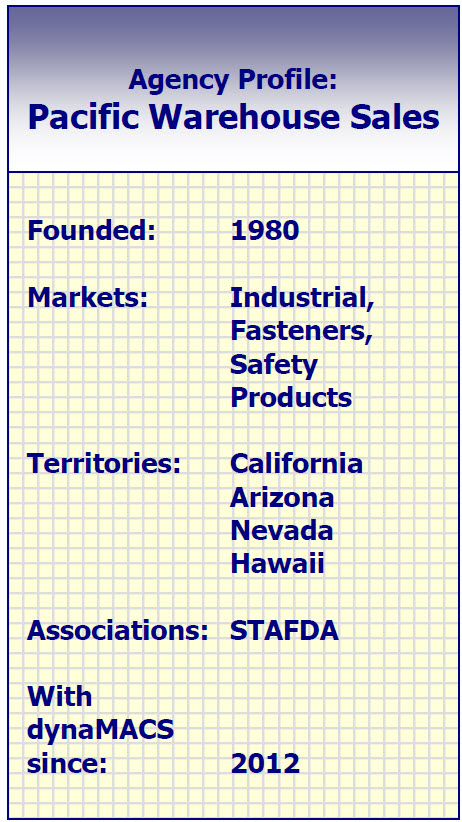
Case Study: Pacific Warehouse Sales

It’s crucial that our salespeople are connected to information at all times, no matter where they are. dynaMACS gives us that ability and much more.”

Deb Kanne, President
Pacific Warehouse Sales

Pacific_Warehouse_Sales_LogoClient Challenge

Pacific Warehouse Sales knows the power of technology and its ability to fuel efficiency and operations. However, the software they were using was outdated. It wasn’t user friendly and it wasn’t compatible with today’s newer computers. It was time for newer, better sales agency software.


Pacific_Warehouse_Sales_StatisticsdynaMACS Solution

Deb Kanne, President of Pacific Warehouse Sales, explained that the agency selected dynaMACS because it was created specifically for sales agencies, so it has all the features Pacific needs to operate and sell at maximum capacity.

Particularly for the sales team, who live and work in geographies scattered across the western United States, Kanne says, “It’s crucial that our salespeople are connected to information, no matter where they are. dynaMACS gives us that ability and much more.”

The Pacific Warehouse sales team, all of whom have iPads or laptops, are able to access the most up-to-date sales and commission numbers immediately from wherever they are.

Pacific Warehouse Sales is on the cloud. So when the operator enters sales and commission information, it is updated instantly on the cloud. All office locations and every sales rep can access the most up-to-date information at any given moment.

An unexpected benefit has come from the agency’s use of dynaMACS. “Customers are impressed by it. We are able to show them real-time information. Before dynaMACS, the customers didn’t know if lines are up for down. The sales managers of the lines we represent are always impressed,” Kanne says.

For her job, Kanne find Sales IQ to be useful and easy-to-use. She can view data any way she likes. “I can drill down to information sorted by manufacturer, customers or salesmen. It’s a great tool that is extremely informative and helps me work more efficiently.”

Tip #1311 – How to Display Quarterly Numbers in Sales IQ

This tip is superseded by Tip #1508

In dynaMACS Sales IQ you can modify the display of data by changing the As-of and Year End dates to create a display of sales information for a specified period of time. The following examples explain how to achieve these results.

Example 1:

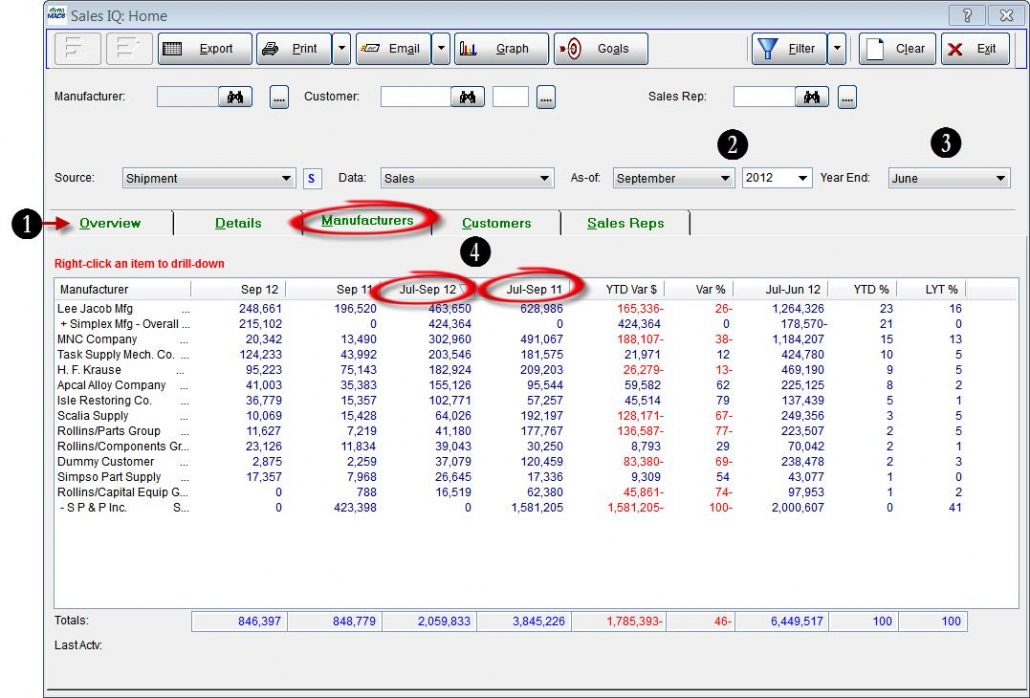
To create a Sales IQ list view displaying sales data for the 3rd quarter of the year 2012:

  1. From the Sales IQ Home screen select any tab. In this example we have selected the Manufacturers tab.
  2. Change the As-of date to the last month of the quarter you are reporting. In this case it will be September which is the last month of the 3rd quarter.Then select the year that applies.In this example we are selecting 2012.
  3. Change the Year End to the month prior to the start of the period you are reporting on. In this case it will be June since our quarter begins with July.
  4. Notice that these columns have changed to Jul-Sep12 and Jul-Sep 11 representing 3rd quarter data for 2012 and 2011.

SIQ Home Screen #1

Example 2:

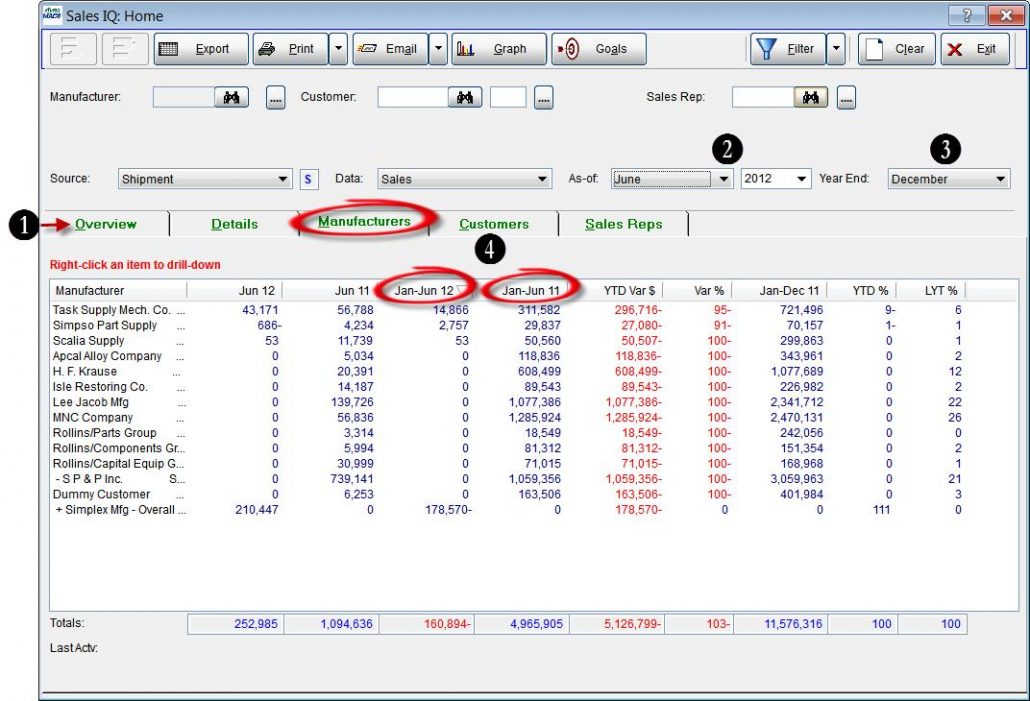
To create a Sales IQ list view displaying sales data for the first half of the year 2012:

  1. From the Sales IQ Home screen select any tab.In this example we have selected the Manufacturers tab.
  2. Change the As-of date to the last month of the half you are reporting.In this case it will be June which is the last month of the 1st half of the year. Then select the year that applies.In this example we are selecting the year 2012.
  3. Change the Year End to the month prior to the start of the period you are reporting on.In this case it will be December since our first half begins with January.
  4. Notice that these columns have changed to Jan-Jun 12 and Jan-Jun 11 representing 2nd half data for 2012 and 2011.

SIQ Home Screen #2

Quick Reference Guide

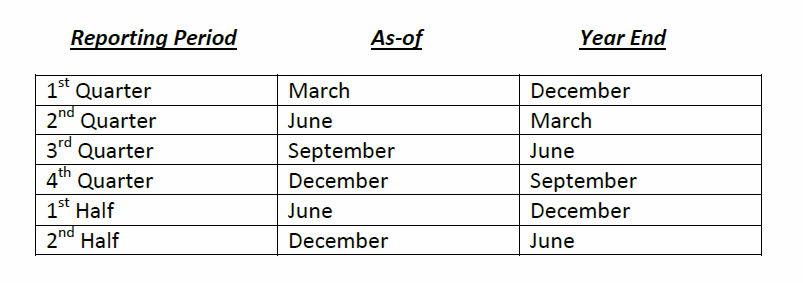
The following is a quick reference guide to use for obtaining quarterly and semi-annual data.

Reference_Graph

Tip #1310 – Transferring history from one sales rep to another sales rep

In our Tip #1309 we talked about using the Global Update feature to update customer information. When using that feature to change sales reps, history records are not updated. This allows for multiple sales reps to have history under a single customer. However, many agencies DO want to have all prior sales history assigned to the new sales rep. By using the Update History to Current Rep feature, you can easily move the history from the old rep to the new rep. The following steps outline this process.

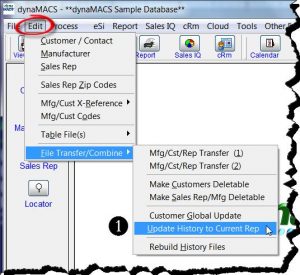
  1. To access the Update History to Current Rep feature, select File>File Transfer/Combine>Update History to Current Rep.Main Screen
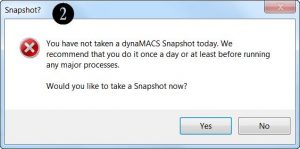
  2. If you have not created a restore point prior to selecting the Update History to Current Rep <feature, you will be prompted to do so.SnapshotStep2_Warning
  3. After the Restore Point process is complete the Update History dialog box will appear. Enter the OLD sales rep code where the history resides.
  4. Select the Update button.Step3_Warning
  5. Select the Yes button on the Caution dialog box to continue.Caution
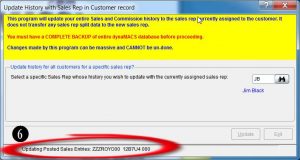
  6. The Update History dialog box will appear while the records are being updated. This dialog box will close when the update is complete.Update History Screen 2

Case Study: Ralph E. Russell Co., Inc.

“Once we used dynaMACS we were hooked. We wouldn’t use any other software for tracking sales and commissions.”

Cathy Pierstorff
Ralph E. Russell Co., Inc.

Ralph_E_Rusell_LogoClient Challenge

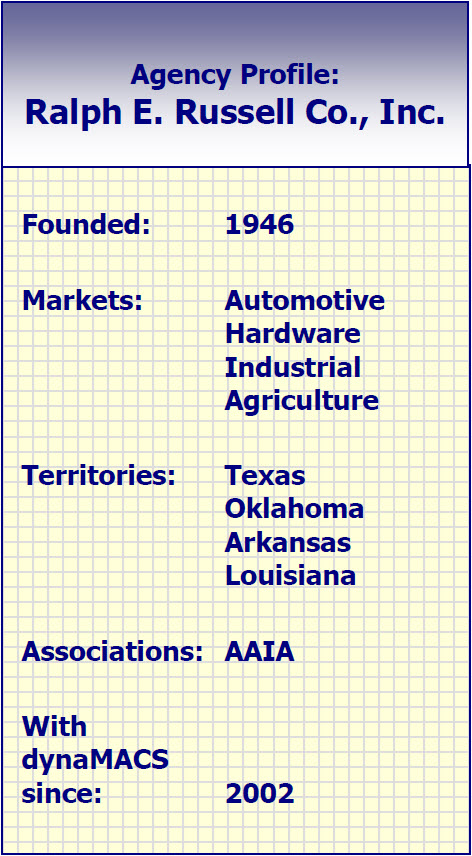
Back in 2002, Ralph E Russell, a sales agency in the automotive hardware, industrial and agriculture industry, had had it with their old software. “It was a custom-written program, and there were so many glitches. Nothing was easy and we spent too much time fixing mistakes,” says office manager and operator Cathy Pierstorff.

Ralph_E_Russell_StatisticsdynaMACS Solution

All that changed after Ralph E. Russell Co. saw a demo of dynaMACS. Once the agency made the switch, tracking sales and commissions was never the same. “Once we used dynaMACS, we were hooked. We wouldn’t use any other software program for tracking sales and commissions,” Pierstorff says.

She was impressed that dynaMACS seamlessly transferred a year’s worth of sales and commission numbers from the old software. The agency didn’t lose any information, and Pierstorff says the software was so user friendly, the agency was up and running with no downtime.

“dynaMACS has made sales and commission processes more organized and less time consuming,” Pierstorff, a long-time dynaMACS user, says.

With dynaMACS, the Ralph E. Russell team has instant on-screen access to all sales and commission information. The agency can analyze sales trends, choose how they want to view information, calculate commissions and customize reporting.

dynaMACS gives us the ability to access sales information, sales trends and profitability accurately throughout the year. It’s a very valuable tool for our company, said R.E. (Butch) Russell.

When the team at Ralph E. Russell agency found dynaMACS, they found an efficient and easy way to analyze sales, pay reps and track commissions.

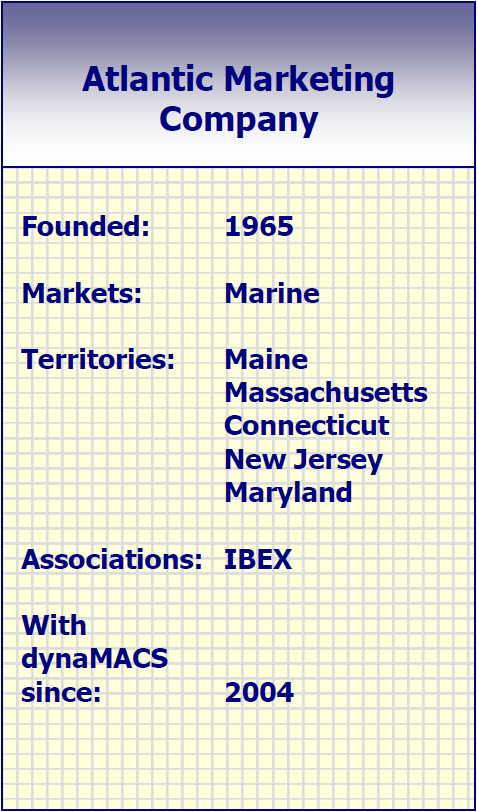
Case Study: Atlantic Marketing Company

“We’re more efficient, better at planning and better at allocating resources to the areas where we’re earning the most income.”

Brandon Flack, President
Atlantic Marketing Company

Atlantic_Marketing_LogoClient Challenge

While Atlantic Marketing Company thrives on efficiency, the sales agency identified two areas that needed improvement. First, reduce the amount of time it took to manually enter sales and commission data. Second, communicate key sales data faster and easier to reps, regional offices and management.

Atlantic_Marketing_StatisticsdynaMACS Solution

One solution solved both challenges: dynaMACS. Brandon Flack, President of Atlantic Marketing, says of the software: “We’re more efficient, better at planning and better at allocating resources to the areas where we’re earning the most income.” dynaMACS also identifies regions that are underperforming and helps uncover trends that could be causing a territory to fall behind.

Atlantic Marketing uses dynaMACS on the cloud, so data is processed and always accessible. Flack logs in and sees the most recent information. Flack says he uses dynaMACS to:

    “Whether it’s good or bad, I can understand why.”

    Compare historical data. “I can select data for any point in time and see sales history for up to 5 years.”

    Communication tool: “I conduct conference calls with manufacturers to review and discuss performance.” 

    “I view monthly reports by sales rep.”

The agency uses eSi to process electronic files (like excel spreadsheets) provided by manufacturers. From a time-saving perspective, Office Manager Kristen Townsend, says “I’m able to maximize my time. With eSi, I don’t need to do data entry. I no longer need physical invoices for commission reconciliation. Once a manufacturer is set up in eSi, I receive an attachment, hit upload and I’m done. I can’t even calculate the amount of time I save. The difference is amazing.”

The bottom line: dynaMACS is a powerful and user friendly tool that makes it easy to receive, distribute, view, analyze and share data. What could be more efficient than that?